
2.4GHz WiFi & ISM Band Scanner
![]()
![]()
![]() Have you ever wondered exactly what is going on in the 2.4GHz WiFi and ISM band around your house. What channel is it best to set your wireless router to? Why are you getting such poor performance across your WiFi network? Is your neighbour on the same frequency?
Have you ever wondered exactly what is going on in the 2.4GHz WiFi and ISM band around your house. What channel is it best to set your wireless router to? Why are you getting such poor performance across your WiFi network? Is your neighbour on the same frequency?
Just what is out there? This neat little gadget will sniff the airwaves and give you a graph of the signal strength vs frequency across the entire band. It connects to your computer by USB 2.0 and with the companion Windows software you can display the spectrum or save the raw data to an Excel compatible file for some more number crunching.
It uses just two significant components, a radio module from Cypress Semiconductor and a PIC microcontroller. Total cost to build it should be less than US$30.
This project was inspired by an article by Jason Hecker in the June 2007 issue of Elektor. Thanks Jason.
The 2.4GHz Band
The 2.4GHz ISM (Industrial Scientific Medical) band is often called the WiFi band because it is used for WiFi networking (ie, 802.11 b/g/n). This band is unlicensed, meaning that you and anyone can transmit on it. As a result it has been used by a multitude of products including video transmitters, portable telephones, Bluetooth devices, wireless keyboards, toys and so on. Because you cannot see what is going in the band on you can experience strange behaviour from your wireless gadget. All of a sudden your wireless keyboard skips characters, is it because someone is using a portable phone on the same frequency?
The biggest victim is WiFi networking. This needs a lot of bandwidth, is always transmitting and is sensitive to interference. This is why people often cannot get a decent range from their wireless network and give up in disgust.
This scanner will draw a graph on your computer screen showing you the activity across the band and indicate the best frequencies to use. If you use a laptop you can also wander around and identify the culprits that are clogging the airwaves.
How It Works
Internally the scanner is very simple. It just contains a radio receiver and a microcontroller…

The radio receiver is the Cypress CYWUSB6935 Radio SoC (System on a Chip). This is a complete low power radio transmitter/receiver chip for the 2.4GHz band and is controlled by a microcontroller over a synchronous serial (SPI) interface. The microcontroller can write to various registers in the chip to set things like operating frequency and can read other registers to retrieve data from the chip.
This chip is designed to operate over the 2.4GHz band and has the ability to listen on a frequency for any other devices that may be already using the frequency. This is to help the microcontroller select a suitably free frequency before transmitting. The chip reports the signal level as a number typically up to 30, with zero representing no signal. We use this facility in this project - simply put, the microcontroller instructs the module to step to a frequency and measure the signal level at that frequency, when done it steps the chip to the next frequency and instructs it to measure the signal level there. And so on, right across the band.
We actually do not use the transmit/receive function, which is normally the chip's main purpose in life.
The microcontroller used in this project is the Microchip PIC 18F2550 which integrates the complete USB 2.0 functionality. The microcontroller sets the radio chip to a frequency, reads the signal level from the chip, stores the value in its internal memory and steps on to the next frequency. This continues until the complete 2.4GHz band is covered. The 18F2550 then sends the data off to your computer using USB and your computer, using custom software, displays the resultant spectrum.
Physically the scanner is just a small box hanging on the end of a USB cable.
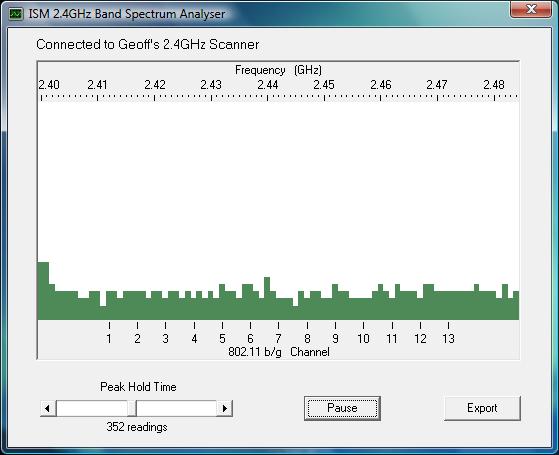
Using the Scanner With nothing running in the immediate vicinity you will just see background noise, as shown in the screen shot on the right. Note that the vertical scale is not calibrated to any particular scale. In fact the scale is just the signal level "factor" reported by the Cypress radio module. The base level signal represents the noise in the air and in the radio receiver part of the module. |
 |
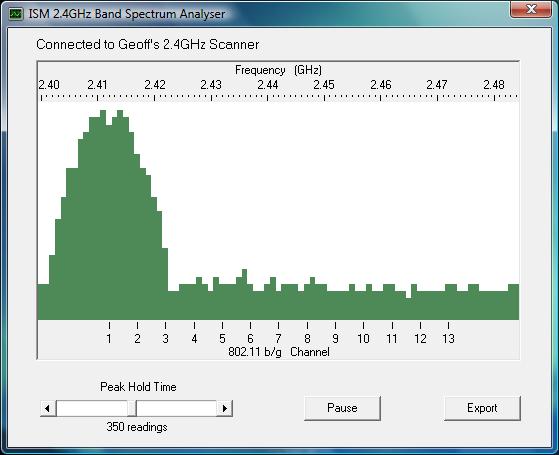 |
That is the good thing about using channel 1 and 13 for your WiFi setup, you get some unused channels on one side where your spectrum can spread into. But, using channel 13 has its own problems. |
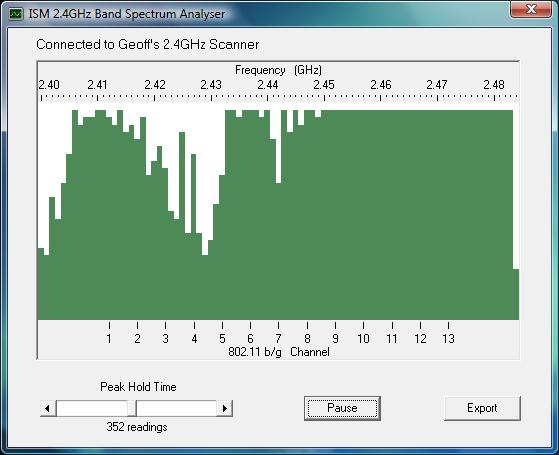
The spectrum on the right is identical to the one above but this time my microwave oven was heating up dinner. Incidentally, the microwave oven was nothing special, just a domestic model and about 10 metres from the scanner. As you can see, it totally blotted out the higher frequency end of the band. All microwave ovens seem to use this part of the band and you cannot blame the microwave for their activity, as this was part of the reason for setting up the 2.4GHz ISM band in the first place.
|
 |
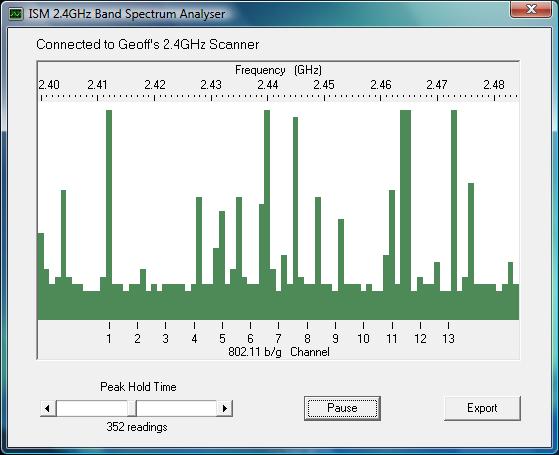 |
Avoiding the microwave oven interference and having some free spectrum on one side is the reason why channel 1 is the best choice for your router (assuming your neighbour has not got there first). Finally, the screenshot on the left shows a Bluetooth mouse communicating with a computer. Bluetooth hops all over the 2.4GHz band as it finds the best spots with the minimum of interference. Spikes all over the spectrum is a good indicator of Bluetooth activity. |
The Circuit
The circuit is the simplest part of this project. Click on the image or go to the download section at the bottom of this page for a full scale drawing.
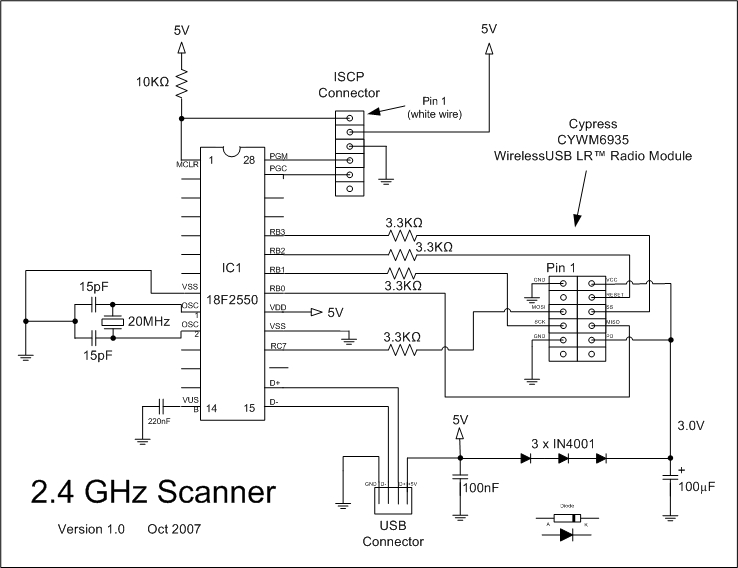 The PIC 18F2550 microcontroller is a 28 pin part with a built in USB 2.0 interface. As mentioned before, the chip integrates everything connected with the USB including a 3.3V regulator, memory buffers and the USB transceiver. All that you need to do is to connect the USB cable to pins 15 and 16 of the chip and place a capacitor on pin 14 to help smooth the inbuilt 3.3V supply.
The clock for the microcontroller is derived from the 20MHz crystal with the two 15pF capacitors providing the correct loading for the crystal. Internally within the 18F2550 the 20MHz is divided by 5 to give 4MHz and then used to synchronise a phase locked loop (PLL) oscillator running at 48MHz. This is the main clock used within the microcontroller and is used to drive both the USB interface and the CPU. Running at 48MHz this is a speedy little chip so we do not have any issues with performance.
The ISCP connector is there so that I could reprogram the 18F2550 without pulling it out of its socket. It is mostly used for prototyping so you can leave it out if you want. Note that the 10K resistor on pin 1 of the 18F2550 is still needed to pull the reset line high.
Power for the circuit is drawn from the +5V supplied by the host computer on the USB cable. The whole circuit only draws a few tens of milliamps so it is not a significant load. This 5V is dropped to about 3V by three 1N4001 diodes to provide power for the Cypress CYWUSB6935 chip which is mounted on a small PCB (the CYWM6935 module). Each diode will drop about 0.7V resulting in a total voltage drop of about 2V. This is a crude way to derive a 3V supply but it is low cost and does the job without any hassles.
The CYWUSB6935 chip has protective diodes on its inputs, which clamp the signal line to its power supply (3V). This means that we can drive it with 5V signals from the microcontroller with series resistors to limit the current. This is the purpose of the 3.3K resistors, they limit the current in the clamping diodes to less than a milliamp when the PIC's output goes to 5V.
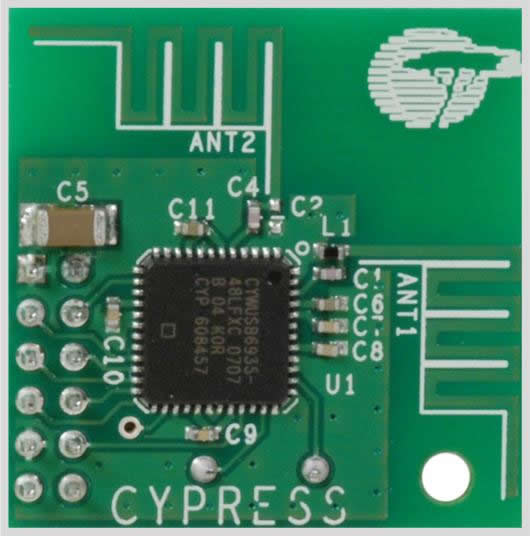 CYWM6935 Module
The CYWUSB6935 chip comes in a tiny package designed for machine assembly and is virtually impossible for a mortal wielding a soldering iron to solder. Fortunately Cypress have assembled it into the CYWM6935 module along with two aerials, a crystal and a few capacitors. The connector used in the module is still rather tiny and non standard (or rather it does not use the 0.1" grid that we know and love), but it can be soldered to. For details of the CYMUSB6935 chip and CYWM6935 module go to here.
Parts Listing
1 x Microchip PIC18F2550-I/SP microcontroller programmed with the firmware available in the download section at the bottom of this page.
1 x Cypress CYWM6935 radio module,
1 x 20MHz crystal
3 x 1N4001 silicon diodes
4 x 3.3K resistors (quarter or half watt)
1 x 10K resistor (quarter or half watt)
2 x 15pF ceramic capacitors
1 x 100nF multilayer ceramic capacitor 1 x 220nF polyester capacitor
1 x 100uF electrolytic capacitor (6V or higher)
1 x 28 pin IC socket
1 x USB cable with a type A connector on one end
1 x UB5 jiffy box
The PIC18F2550-I/SP can be purchased from futurlec.com, farnell.com, rs-components.com, digikey.com and others. As at May 09, it should cost under US$9. The CYWM6935 module can be purchased from digikey.com, mouser.com and farnell.com. It should cost under US$15 although it may cost a lot more in the future as it is being phased out. The other parts are standard.
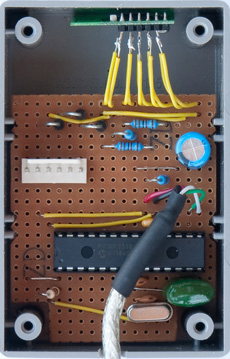 Assembly
Because the circuit was so simple I took the easy way out and assembled it on a piece of veroboard. Nowadays I would design my own printed circuit board (see custom PCBs).
Rather than finding a connector for the Cypress module I simply soldered single core hookup wire directly to the connector pins. This supported the module and allowed me to position it away from the microcontroller to minimise interference.
The USB cable was made from a standard USB cable with type A and B connectors, I just cut off the B connector and soldered the wires directly to the veroboard with half an inch of heatshrink tubing to keep it neat. That left the type A connector at the other end, ready to plug into the computer.
Note that the red and black wires in the USB cable are +5V and ground respectively. You should check these with a multimeter before soldering them in. The green wire is normally D+ and goes to pin 16 of the 18F2550 while the white is D- and goes to pin 15. The shield does not have to be connected.
The final touch was to drop the assembly into a standard UB5 "jiffy" box with a notch cut out for the USB cable to pass through.
 Plugging It In
Because the scanner uses standard USB it can be connected to any computer, although the software is written only for Windows XP, Vista and Windows 7.
Before you plug the scanner in you must install the software first. This is available in the download section below. Failure to install the software first will result in Windows identifying the scanner as an "Unidentified Device".
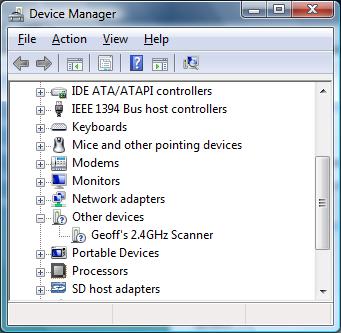
During installation of the software a device driver is installed and it is this that helps Windows identify the scanner. After you have correctly installed the software and plugged in the scanner you should see the device show up under "Other Devices" in Device Manager as shown on the left.
When you fire up the desktop software (ISMScanner.exe) you should see the message in the software window stating "Connected to Geoff's 2.4GHz Scanner". If you get "Scanner not found" then the scanner is not plugged in or not working.
PIC Firmware
The firmware running on the PIC 18F2550 was written for the CCS C compiler and uses the CCS USB protocol stack, which in turn appears to be derived from Microchip code. At the top level it is quite simple, it just repeatedly steps through the frequency range taking readings.
For each frequency it takes repeated readings until it gets what seems to be a consistent value. It then saves that value and moves on to the next frequency. When it has finished running through the band it sends off all readings to the computer over the USB. The CYWUSB6935 chip steps 1MHz at a time and the band is 85MHz wide, so the number of readings sent to the computer is 85. Despite the repeated measurements needed to get a consistent reading the chip achieves quite a good performance, about 4 complete spectrum scans every second.
The firmware and source code for the 18F2550 is available from the download section below.
Windows Software
The software running on the computer was written in Visual Basic 5. It is not particularly sophisticated, for example it keeps polling the USB interface to see if new data has arrived and that uses up a lot of CPU time. But, you don't generally use the scanner for a lot of time and you would not normally be running computer games at the same time, so this inefficiency is not of great importance.
The software on the computer saves the set of readings into an array. When it comes to drawing the spectrum display on the screen it steps through all the saved readings for each frequency looking for the highest reading, and it is that highest reading that it draws on the screen for that frequency. As a new reading is received the oldest reading in the array is discarded. The slider on the screen controls how many readings are saved for each frequency, the default is 350 readings which represents about 90 seconds of data.
All this means that the delay has a "memory" and one high reading will hang around for 90 seconds until it is flushed out. This is done because devices normally hop around in frequency and it would be hard to see what frequencies were popular unless there was some way of holding on to the reading for a while. You can see this in action when there is a noise spike. That spike would remain on the screen for (say) 90 seconds then disappear. But a device that communicated on that frequency (amongst others) would in most probability revisit that frequency within the 90 second period and that would place a new high value into the array of values for that frequency.
By adjusting the slider you control the size of this array and consequently the amount of time that it would take to flush a reading out. Smaller numbers flush more quickly, larger ones take more time. You can pause the display by clicking on the Pause button. Clicking on it again will clear the array and start a new collection. This is also a handy way of clearing everything to restart with a fresh display.
The Export button will export the current set of readings to a .csv file which can be loaded into a spreadsheet like Excel.
As usual, the software and source code is available for download below.
C# Version of the Software
A reader, Jim McCullers in the USA, took up the challenge of porting the desktop software to a more modern environment. The code he wrote compiles under Microsoft Visual C# 2010 Express (the free version) and is also available for download below.
He did not make any major changes to the structure or look but created a new version of the MPUSBAPI to suit C# and made it into a class. The mpusbapi.dll module must be in the same directory folder as the executable so you will notice that he has copies in both the debug and release folders.
I have not tested it extensively so, if you would like to contact Jim, you can find him at jimdev@bellsouth.net.
| Schematic v1.0 | DOWNLOAD |
| Firmware - HEX programming file v1.0 | DOWNLOAD |
| Firmware - source code v1.0 | DOWNLOAD |
| Windows software v1.0 Installation (Visual Basic Version) | DOWNLOAD |
| Windows software v1.0 Source code (C# Version by Jim McCullers) | DOWNLOAD |
| Windows software v1.0 Source code (Visual Basic Version) | DOWNLOAD |
| Windows driver for Vista and Win 7 32/64 bit systems (by Christoph Baumgartner) | DOWNLOAD |